Before going on to learn how to find the p-value (significance) in scikit-learn, let’s understand its meaning and significance. In terms of statistical learning, linear regression is probably the simplest approach.
What is P-value?
P-value is the probability of obtaining test results at least as extreme as the results actually observed, under the assumption that the null hypothesis is correct.
– Wikipedia
In any modeling task, we hypothesize some correlation between the features and the target. The null hypothesis is therefore the opposite: there is no correlation between features and targets. In hypothesis tests, a p-value is used to support or reject the null hypothesis. Smaller the p-value means the mightier the proof that the null hypothesis should be disregarded.
P-values are expressed as decimals, but converting them to percentages may make them easier to understand. For instance, p is 2.94% of 0.0294. This means that your results may be random by 2.94% (happened by chance). This is rather small.
On the other hand, a high p-value of 91% means that your results are 91% random and are not due to anything in your experiment. The smaller the p-value therefore, the more important your results are (“significant”).
Significance Of P-value
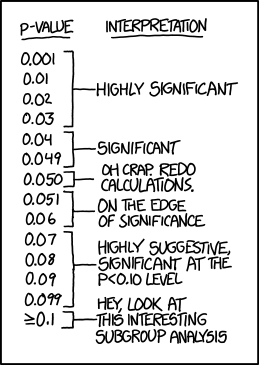
- A p-value of <0.05 is statistically significant. It shows strong proof against the null hypothesis because since the probability is less than 5%. Based on this, we accept the alternative hypothesis and dismiss the null hypothesis.
However, this does not mean that the alternative hypothesis is necessarily true.
- A p-value greater than 0.05 is not meaningful statistically, and indicates strong evidence for null hypothesis. This means that we reject the alternative hypothesis and keep the null hypothesis.
You should be aware that the null hypothesis cannot be accepted, it can be either rejected or not rejected.
How To Find P-value (significance) In Scikit-learn?
Let’s import a built-in dataset “diabetes” and run a linear regression model using Sklearn library.
We’ll calculate p-values using statsmodels library as shown below:
- First, let’s load the important libraries:
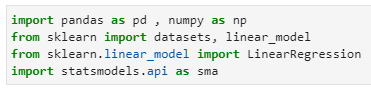
import pandas as pd , numpy as np
from sklearn import datasets, linear_model
from sklearn.linear_model import LinearRegression
import statsmodels.api as sma
- Let’s load the diabetes dataset and define X & y:
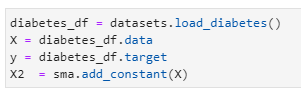
diabetes_df = datasets.load_diabetes()
X = diabetes_df.data
y = diabetes_df.target
X2 = sma.add_constant(X)
- Let’s fit the model:
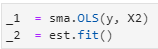
_1 = sma.OLS(y, X2)
_2 = est.fit()
- And the final step, let’s check the summary of our simple model (focus on p-values):
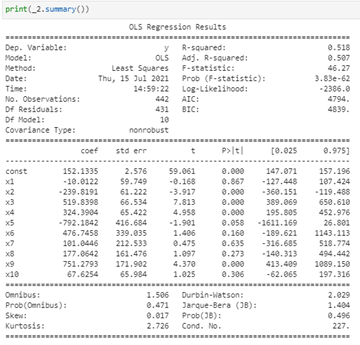
print(_2.summary())
If you noticed, we calculated the p-score using statsmodels library and not scikit-learn. Let’s write a function to calculate p-score using scikit-learn as shown below :
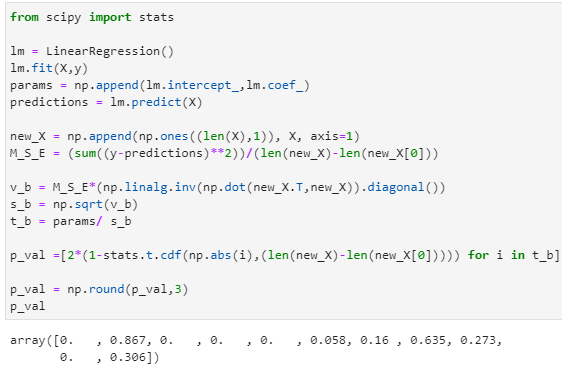
from scipy import stats
lm = LinearRegression()
lm.fit(X,y)
params = np.append(lm.intercept_,lm.coef_)
predictions = lm.predict(X)
new_X = np.append(np.ones((len(X),1)), X, axis=1)
M_S_E = (sum((y-predictions)**2))/(len(new_X)-len(new_X[0]))
v_b = M_S_E*(np.linalg.inv(np.dot(new_X.T,new_X)).diagonal())
s_b = np.sqrt(v_b)
t_b = params/ s_b
p_val =[2*(1-stats.t.cdf(np.abs(i),(len(new_X)-len(new_X[0])))) for i in t_b]
p_val = np.round(p_val,3)
p_val
Summary
In this lesson on how to find p-value (significance) in scikit-learn, we compared the p-value to the pre-defined significant level to see if we can reject the null hypothesis (threshold).
If p-value ≤ significant level, we reject the null hypothesis (H0)
If p-value > significant level, we fail to reject the null hypothesis (H0)
We also learned how to calculate p-values in using statsmodels and scikit-learn libraries.
References
- Information on P-values
- Official documentation of statsmodels
- Official documentation of scikit-learn
- Official documentation of linear regression
- Image credit: xkcd
Recommended Books:
The books above are affiliate links which benefit this site.