You probably spend a lot of time cleaning and modifying data for use in your applications if you’re a data scientist or data analyst. The Pandas Python library is one of the most important libraries for data preparation.
In this article, we’ll cover :
- To segment your DataFrame into groups, use Pandas groupby.
- Common GroupBy problems
Let’s get started.
Pandas GroupBy:
In Python, Pandas’ GroupBy is a strong and flexible tool. It enables you to divide the data into distinct classes in order to perform computations and perform better analysis.
To explain this, let me use an illustration. Let’s pretend we’re trying to figure out how much an individual weighs in a neighbourhood. We can easily estimate their weight by calculating the average weight of all city dwellers. But here’s a question: does a person’s gender influence their weight?
We may divide the city dwellers into gender groups and determine their average weight. This will provide us with a greater understanding of a city dweller’s weight. But, since a teenage boy’s weight will vary from that of an adult male, we can probably get a better picture if we further divide these gender groups into different age groups and then take their mean weight!
You can see how dividing people into groups and then applying a statistical value helps us to make more accurate analyses than just looking at the statistical value of the whole population. This is why GroupBy is so perfect!
GroupBy helps us to group our data based on various characteristics to get a more detailed picture of our data. It’s a one-stop shop for extracting actionable insights from your data!
Understanding dataset and problem statement :
Before starting, we will be working with a Kaggle dataset – Big Mart Sales (download train.csv)
It provides information about the items offered at BigMart’s different locations. The goal is to figure out how much each product sells in a specific store.
Let’s see how our DataFrame looks like :
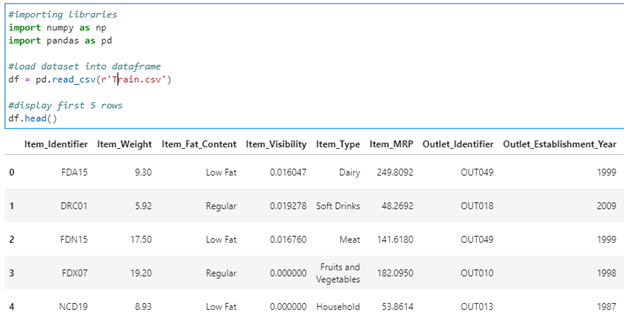
#importing libraries
import numpy as np
import pandas as pd
#load dataset into dataframe
df = pd.read_csv(r’Train.csv’)
#display first 5 rows
df.head()
There are many columns in the dataset as shown below :
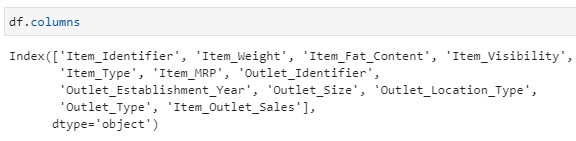
df.columns
First Glance at GroupBy :
Let’s find the count of different outlet location types:
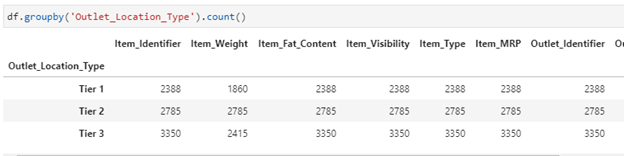
df.groupby(‘Outlet_Location_Type’).count()
Since we didn’t specify which column we wanted the aggregation function to be applied to, GroupBy applied it to all applicable columns and returned the results.
So, lets find out total sales for each form of location:
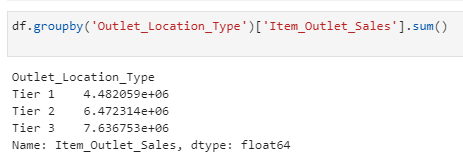
df.groupby(‘Outlet_Location_Type’)[‘Item_Outlet_Sales’].sum()
GroupBy follows The Split-Apply-Combine Strategy:
You just saw how easily the GroupBy feature can provide insight into a group of data. But there’s a lot going on behind the scenes that you need to know about in order to understand GroupBy’s true power.
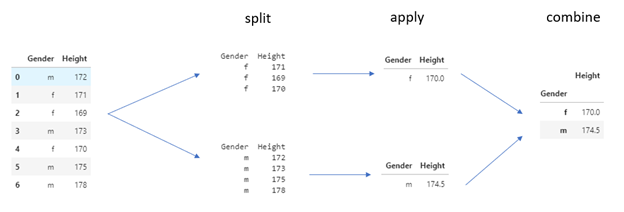
Hadley Wickham invented the Split-Apply-Combine technique in his 2011 article, and GroupBy uses it. A data analyst may use this technique to break down a large problem into manageable parts, perform operations on individual parts, and then reassemble them to address a particular query.
Working with a sample dataset to get the average height for males and females in a population, I’d like to demonstrate how this technique works in GroupBy. Let’s get started on the dataset:
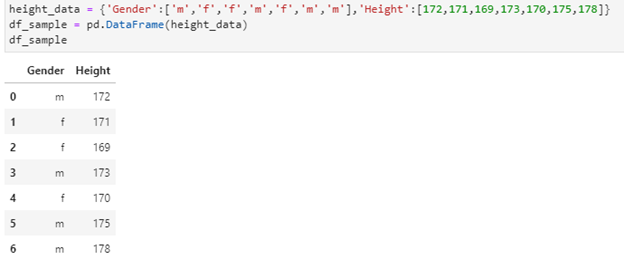
height_data = {‘Gender’:[‘m’,’f’,’f’,’m’,’f’,’m’,’m’],’Height’:[172,171,169,173,170,175,178]}
df_sample = pd.DataFrame(height_data)
df_sample
What if we want to calculate average height of Males and Females?
- Organizing the data into distinct groups:
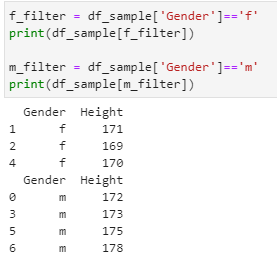
f_filter = df_sample[‘Gender’]==’f’
print(df_sample[f_filter])
m_filter = df_sample[‘Gender’]==’m’
print(df_sample[m_filter])
- Finding the average :
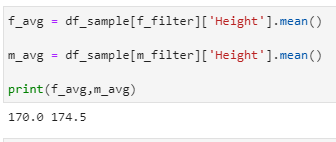
f_avg = df_sample[f_filter][‘Height’].mean()
m_avg = df_sample[m_filter][‘Height’].mean()
print(f_avg,m_avg)
- Combining output :
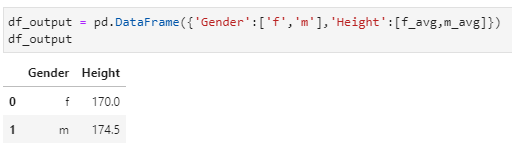
df_output = pd.DataFrame({‘Gender’:[‘f’,’m’],’Height’:[f_avg,m_avg]})
df_output
With only one line of code, you can accomplish all three steps using GroupBy! Here’s how to do it:
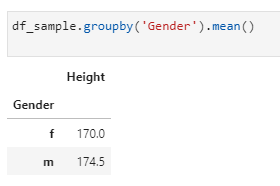
df_sample.groupby(‘Gender’).mean()
Let’s have a look at how GroupBy works:
You can see how GroupBy makes our job easier by taking care of all behind the scenes so we don’t have to!
Now that you know what the Split-Apply-Combine technique is, let’s take a closer look at the GroupBy feature to see what it can do.
Applying Functions to GroupBy Groups
The apply step of a GroupBy function is without a doubt the most important, as it allows us to perform a variety of operations using aggregation, transformation, filtration, or even our own function!
Let’s take a closer look at these.
Aggregation:
Look at all of the Pandas package’s aggregate functions:
- count() – Number of non-null observations
- sum() – Sum of values
- mean() – Mean of values
- median() – Arithmetic median of values
- min() – Minimum
- max() – Maximum
- mode() – Mode
- std() – Standard deviation
- var() – Variance
But the agg() function in Pandas gives us the flexibility to perform multiple statistical computations all at once! This is how it works:
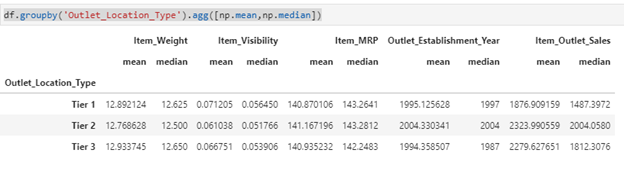
df.groupby(‘Outlet_Location_Type’).agg([np.mean,np.median])
We can use any of the aggregated function on the dataset to get our desired output.
Transformation:
We can use transformation to perform any calculation on the entire group and then return the combined DataFrame. The transform() function is used to accomplish this.
Using the transform() function, we’ll try to calculate the null values in the Item_Weight column.
Don’t you think the Item_Fat_Content and Item_Type would have an effect on the Item Weight? So, let’s group the DataFrame by these columns and use the mean of these groups to handle the missing weights:

df[‘Item_Weight’] = df.groupby([‘Item_Fat_Content’,’Item_Type’])[‘Item_Weight’].transform(lambda x: x.fillna(x.mean()))
This will replace the null values with the mean of respective column.
Filtration:
Filtration helps one to exclude those values from the category based on calculation and only return a subset of the total. We can do this with Pandas’ filter() feature.
Let’s take a look at how many rows are currently in our DataFrame:

df.shape
I could use the filter feature to select only those groups with item weights within three standard deviations:
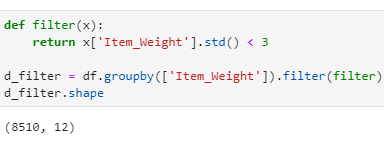
def filter(x):
return x[‘Item_Weight’].std() < 3
d_filter = df.groupby([‘Item_Weight’]).filter(filter)
d_filter.shape
Only those classes with Item Weight less than 3 standard deviations have been returned by GroupBy in a DataFrame.
Applying own function:
The apply() function in Pandas runs a function along one of the DataFrame’s axes. We may add any function to the grouped result by using it with the GroupBy function.
What if we want to calculate something which is not part of Pandas library?
For instance, if I wanted to see the Item MRP values with the mean of their establishment year group, I could do so with the apply() function:
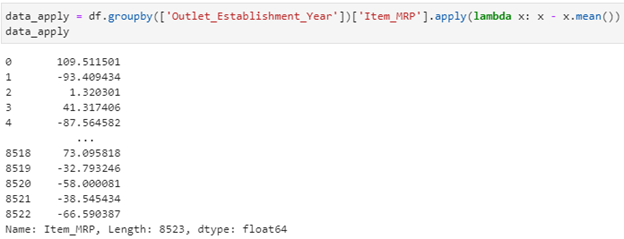
data_apply = df.groupby([‘Outlet_Establishment_Year’])[‘Item_MRP’].apply(lambda x: x – x.mean())
data_apply
The prices have been grouped here, and you can see if the item sold for more than or less than the mean MRP for that year.
Lets now focus on common GroupBy problems:
1- How to convert a pandas groupby output from series to dataframe
We can simply use .reset_index() method with .groupby() function to solve this problem.
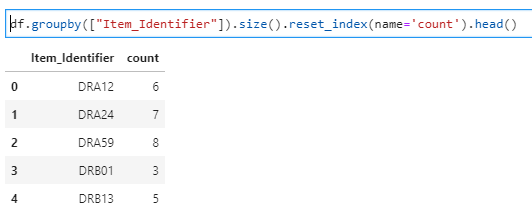
df.groupby([“Item_Identifier”]).size().reset_index(name=’count’).head()
2 – Get statistics for each group (such as count, mean, etc) using pandas GroupBy?
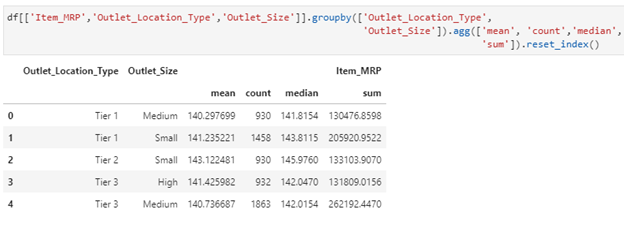
df[[‘Item_MRP’,’Outlet_Location_Type’,’Outlet_Size’]].groupby([‘Outlet_Location_Type’,’Outlet_Size’]).agg([‘mean’, ‘count’,’median’,’sum’]).reset_index()
3 – Get counts from GroupBy on 2 Columns of DataFrame:
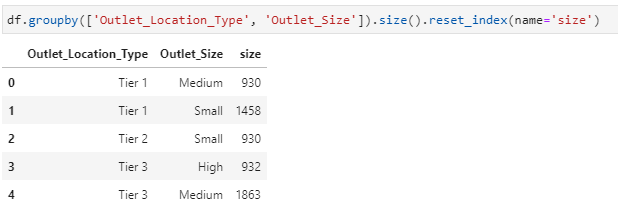
df.groupby([‘Outlet_Location_Type’, ‘Outlet_Size’]).size().reset_index(name=’size’)
4 – Get rows having max value in groups using GroupBy:
Let’s find out the maximum value of Item_MRP after grouping Outlet_Location_Type and Outlet_Size as shown below :
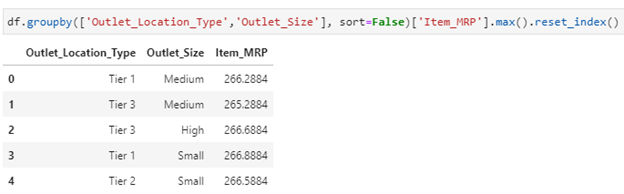
df.groupby([‘Outlet_Location_Type’,’Outlet_Size’], sort=False)[‘Item_MRP’].max().reset_index()
5 – How to sort within groups when using GroupBy:
Let’s create a simple dataframe to solve this problem :
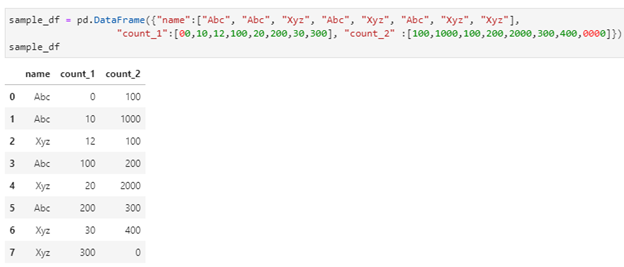
sample_df = pd.DataFrame({“name”:[“Abc”, “Abc”, “Xyz”, “Abc”, “Xyz”, “Abc”, “Xyz”, “Xyz”], “count_1”:[00,10,12,100,20,200,30,300], “count_2” :[100,1000,100,200,2000,300,400,0000]})
sample_df
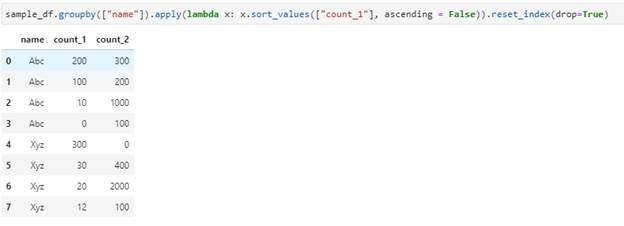
sample_df.groupby([“name”]).apply(lambda x: x.sort_values([“count_1”], ascending = False)).reset_index(drop=True)
6 – How to group dataframe rows into list using GroupBy:
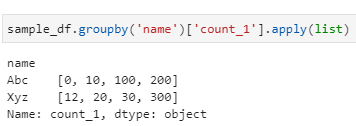
sample_df.groupby(‘name’)[‘count_1’].apply(list)
7 – Apply multiple functions to multiple GroupBy Columns :
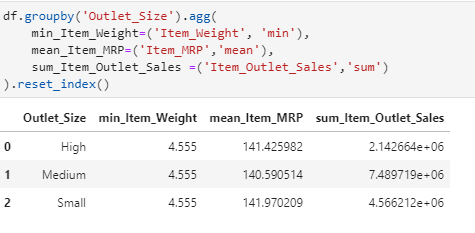
df.groupby(‘Outlet_Size’).agg( min_Item_Weight=(‘Item_Weight’, ‘min’), mean_Item_MRP=(‘Item_MRP’,’mean’), sum_Item_Outlet_Sales =(‘Item_Outlet_Sales’,’sum’)).reset_index()
8 – How to access Pandas GroupBy dataframe by key :
- First take the groupby on desired column
- Use get_group function as shown below
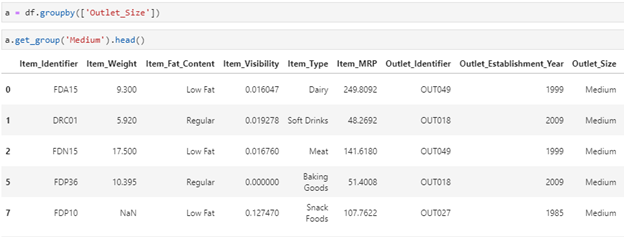
a = df.groupby([‘Outlet_Size’])
a.get_group(‘Medium’).head()
As you can see, I have filtered out on Outlet_Size key as ‘Medium’.
Summary
Thank you for taking the time to read this post. There’s a lot of information here because there are so many different ways to group and aggregate data with pandas. My hope is that you will find this post to be a valuable resource that you will bookmark and return to when you are stuck with a difficult issue of your own.