After cleaning, pre-processing, and completing all the steps of data wrangling, the next thing we do is feed the clean data to a model and, of course, obtain output in probabilities. But hang on. How are we going to evaluate the efficacy of our model? Better effectiveness equals better performance, and that’s exactly what we’re looking for. And it’s here that the confusion matrix takes center stage. The confusion matrix is a machine learning (ML) classification performance metric.
What Is Confusion Matrix?
A confusion matrix is a N x N matrix used to evaluate the performance of a classification model (N = no. of target classes). The matrix compares the actual goal values against the values predicted by a machine learning algorithm. It tells us how well the classification model is working and the types of errors it’s making.
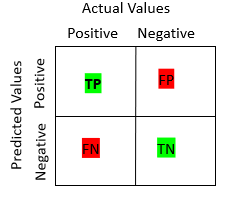
Let’s decode the matrix:
- Target variable has two values : Negative, Positive
- Actual values of target variables are in columns
- Predicted values of target variables are in rows
Let’s now understand what TP, FP, FN & TN mean? Though the acronyms are intuitive in themselves, let’s understand each term:
True Positive (TP)
- The actual and predicted value is same (Positive value).
True Negative (TN)
- The actual and predicted value is the same (Negative value).
False Positive (FP)
- The predictive value was predicted incorrect
- Predicted value is positive but the actual one is negative
- It is also called as Type 1 Error
False Negative (FN)
- The predictive value was predicted incorrect
- Predicted value is negative but the actual one is positive
- It is also called as Type 2 Error
…But Why Do I Need Confusion Matrix?
- It provides details about the classifier’s errors as well as the sorts of errors
- It’s great for measuring things like recall, precision, specificity, accuracy and F1 score
- It is used when there is a significant imbalance in the classification problem, with one class dominating the others
What Is Precision, Recall, Accuracy And F1 Score?
Precision : Precision describes how many precisely predicted values actually turned out positive. Or, to put it another way, it’s the number of right outputs generated by the model out of all the correctly anticipated positive values.
Precision = TP / (TP + FP)
Recall : The term recall refers to how many of the model’s real positive values were accurately predicted. It’s useful when the number of false negatives outnumbers the number of false positives.
Recall = TP / (TP + FN)
Accuracy : As the name suggests, it can be assessed as the ratio of the number of correct predictions produced by the classifier to the total number of predictions made by the classifiers. It explains how frequently the model predicts the correct outputs.
Accuracy = (TP + TN) / (TP + TN + FP + FN)
F1 Score : F score is basically harmonic mean of precision and recall.
F measure = (2*precision* Recall)/ (Precision + Recall)
How To Plot The Confusion Matrix?
Let’s take an example of how to plot confusion matrix and classification report as well:
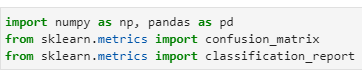
import numpy as np, pandas as pd
from sklearn.metrics import confusion_matrix
from sklearn.metrics import classification_report
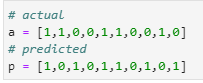
# actual
a = [1,1,0,0,1,1,0,0,1,0]
# predicted
p = [1,0,1,0,1,1,0,1,0,1]
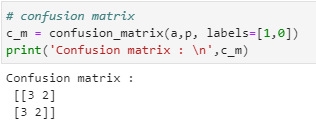
# confusion matrix
c_m = confusion_matrix(a,p, labels=[1,0])
print(‘Confusion matrix : \n’,c_m)
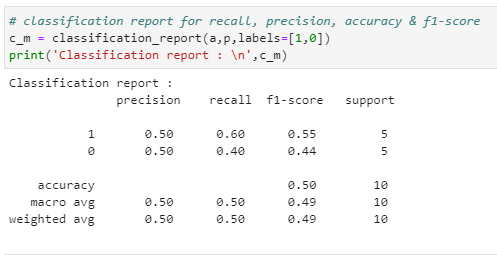
# classification report for recall, precision, accuracy & f1-score
c_m = classification_report(a,p,labels=[1,0])
print(‘Classification report : \n’,c_m)
Summary
We hope that after this lesson, confusion matrix is not so confusing for you anymore. This article must have given you an idea about how to calculate confusion matrix and how to interpret it. Also, using confusion matrix, we’ve learned how to calculate different evaluation metrics like precision, recall, accuracy and F1 score.