Before implementing a simple model based on logistic regression using scikit-learn, let us first understand what is logistic regression. Logistic regression is an extremely effective classification technique. Classification is the practice of utilizing predictive approaches to differentiate categorical data.
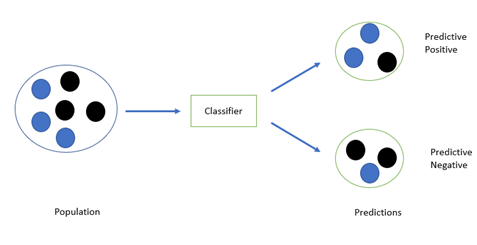
The classifier (classification algorithm) should learn, based on the training dataset, in which the category of outcome is already known. Using this information, and based on the explanatory variables (features), it should be able to predict the category of the new observations.
What Are We Trying To Achieve?
A binary category dependent variable Y model for the logistic regression, capable of taking on two possible values: “0” or “1.” These are two categories that could include the observations (buy/pass, true/false).
Thus, a logistic regression measures the relationship between the dependent variable Y and one or multiple explaining variables X using a sigmoid (logistic) function, by estimating probabilities.
For example: We can predict if a person is going to buy a particular product or not (buy/pass). For default, the category variable dependent gets value as “1” and “0” for not default.
What Is Predicted Probabilities In Logistic Regression?
Going ahead with our chapter on using logistics regression using scikit-learn: the equation for logistic regression is given below:
P(x) = e (Bo + B1x) / 1 + e (Bo + B1x)
Here:
- Bo is the intercept
- B1 is the vector containing the coefficient values for each explanatory variable
Logistic function guarantees the predicted probability outcome will be in the range 0 – 1.
Here is how a sigmoid function looks like:
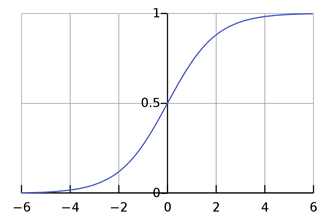
Applying the decision boundaries to the classification helps in distinguishing between the two classes. Let’s take a simple example, if decision limit is 0.5 (p(x) >= 0.5), it will yield “positive” class (Y=1) and Y=0 otherwise.
What Is Maximum Likelihood Estimation?
The coefficients are calculated using maximum likelihood estimation (MLE). Using it, model parameters are measured by maximizing a likelihood function, so that under the assumed logistic regression model, the training data is more ‘probable’.
What Are Log Odds Ratio?
The ratio of the odds of an occurrence in the group to the odds in the other group can be defined. Assume that we are predicting if someone will buy a product, where Y=1 when a customer buys. If two in 20 people buy the product, the odds ratio will be 2:18. In logistic regression model, the log odds for value which is labelled as ‘1’ is a linear combination of the one/multiple predictors (independent variables).
What happens when there are more than 2 categories?
As earlier stated, logistic regression classifier can also be called as a binary classifier. If there are over two categories, we may want to apply multi-class classification, which is an extension of logistic regression. One of the examples of extensions is one-vs-rest logistic regression. In this, for each class, a different model is trained to predict if an unknown observation belongs to that class or not (making it a binary classification issue). It also presumes that each classification problem is independent. We predict the possibility whether the observation belongs to a class by running all these individual logistic regression models. The observation is then assigned to the class that has the highest predicted probability.
Let Us Implement A Simple Logistic Regression Model
Now, to continue with our lesson on logistic regression using scikit-learn. We’ll be using kaggle’s Titanic dataset.
Objective is to forecast the survival that is basis dataset features.
Download train.csv and test.csv and load it into the Jupyter environment.
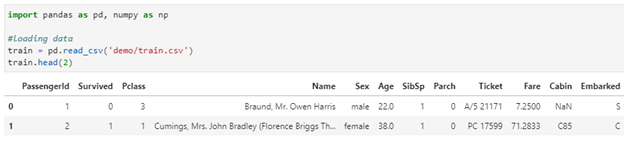
import pandas as pd, numpy as np
#loading data
train = pd.read_csv(‘demo/train.csv’)
train.head()
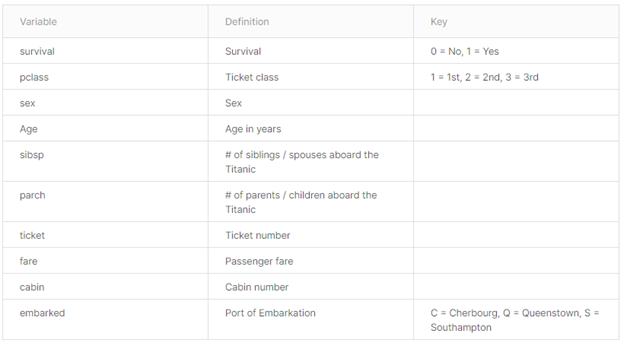
Data dictionary:
Let’s do some pre-processing on data:
- “Passenger Id”, “Ticket”, “Name” and “Cabin” characteristics are removed from the dataset since these columns do not give any predictive power to the model.
train.drop([ ‘Name’, ‘PassengerId’, ‘Cabin’, ‘Ticket’], axis=1, inplace=True)
- Let’s quickly create dummy columns for Embarkment port:
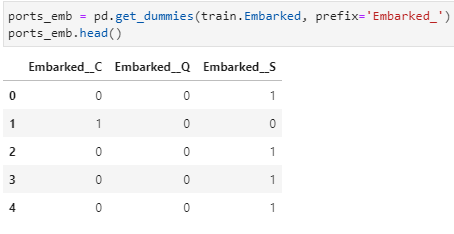
ports_emb = pd.get_dummies(train.Embarked, prefix=’Embarked_’)
ports_emb.head()
Also let’s join the data back to train dataset:
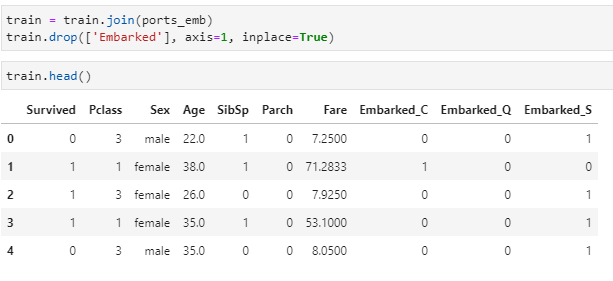
train = train.join(ports_emb)
train.drop([‘Embarked’], axis=1, inplace=True)
train.head()
- Let’s transform the genders to 0 and 1:
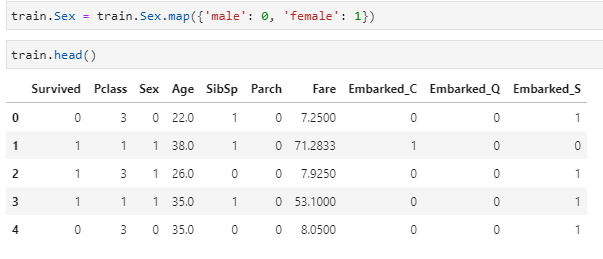
train.Sex = train.Sex.map({‘male’: 0, ‘female’: 1})
train.head()
- Let’s fill the missing values:
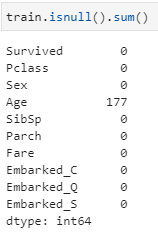
train.isnull().sum()
Age has all the missing values, let’s replace it with mean.
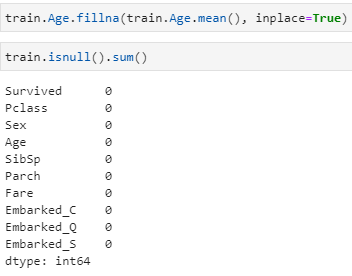
train.Age.fillna(train.Age.mean(), inplace=True)
train.isnull().sum()
- Let’s split the data in train and test:
Pre-processing is completed in the above steps. Let’s keep the target variable (Survived) in y and all other in x as shown below :
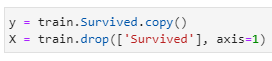
y = train.Survived.copy()
X = train.drop([‘Survived’], axis=1)
To run a model, the data will be divided in two sets: training and testing.
The logistic regression model is trained using the training set. The model will learn using the features in the training dataset. Performance of the model is validated against the test dataset. We would predict whether a person lived for each observation in the test set based on training and compare the predictions to the true values.
Training set will consist of test 25% & 75% data.

from sklearn.model_selection import train_test_split
x_train, x_test, y_train, y_test = train_test_split(x, y, test_size=0.25, random_state=123)
- Let’s build a logistic regression model:
We can fit a logistic regression model to the training data using variables in X train dataset. We will be using the LogisticRegression module present in the scikit-learn package.
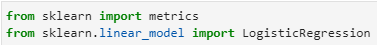
from sklearn import metrics
from sklearn.linear_model import LogisticRegression
Training of the model is completed. Now, we are going to use it predict the ‘Survived’ column.
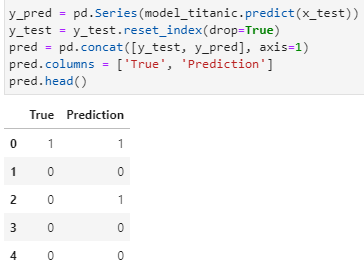
y_pred = pd.Series(model_titanic.predict(x_test))
y_test = y_test.reset_index(drop=True)
pred = pd.concat([y_test, y_pred], axis=1)
pred.columns = [‘True’, ‘Prediction’]
pred.head()
4 out 5 observation are predicted correctly by the model as shown.
- Let’s plot the model accuracy for the complete dataset by using “metrics” module from scikit-learn:
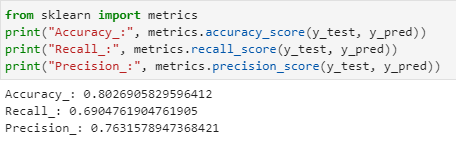
from sklearn import metrics
print(“Accuracy_:”, metrics.accuracy_score(y_test, y_pred))
print(“Recall_:”, metrics.recall_score(y_test, y_pred))
print(“Precision_:”, metrics.precision_score(y_test, y_pred))
As you can see, accuracy for such a simple model is coming out to be 80%.
We can improve the accuracy by doing further feature engineering, pre-processing etc.
- Let us plot the confusion matrix:
We will plot confusion to know how many were classified correctly and otherwise by using “confusion_matrix” from scikit-learn library :
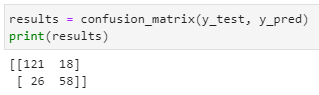
results = confusion_matrix(y_test, y_pred)
print(results)
Confusion matrix interpretation:
- A total of 121 people were properly predicted (did not survive)
- 18 people who did not survive were mistakenly predicted to have survived
- 26 people who survived were mistakenly projected to have died
- 58 people who survived were accurately projected to have died
Summary
There are many pros of using logistic regression model, but there are some cons as well.
Pros:
- Logistic regression is very simple to implement
- Straightforward interpretability
- Does not need a large amount of computing power
Cons:
- Logistic regression is very vulnerable to overfitting
- Non-linear problems cannot be solved using logistic regression
References
- Jupyter Book Online
- kaggle – Titanic dataset
- scikit-learn.org
- Official documentation of Confusion Matrix