This article contains affiliate links. For more, please read the T&Cs.
The Importance of Groupby Functions In Data Analysis
Whether working in SQL, R, Python, or other data manipulation languages, the ability to perform groupby functions on your data is a critical and basic need. The Pandas library for Python makes the process much simpler for data munging than prior approaches with libraries like numpy. In this post, we’ll cover various aspects of how groupby functions work in Pandas along with some commonly asked outputs required of Data Analysts.
Sample Dataset
The first thing we need to do is utlize a dataset for our analysis. In our case this will be an open source dataset from FSU with some housing data.
import pandas as pd
file_name = "https://people.sc.fsu.edu/~jburkardt/data/csv/homes.csv"
df = pd.read_csv(file_name)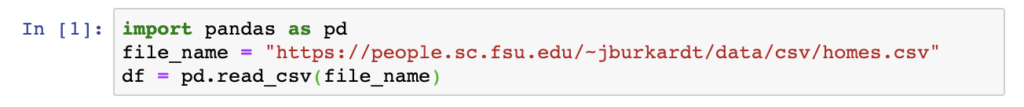
We’ll ignore the data definitions here and will focus our time grouping by the variables Beds and Baths.
Groupby in Pandas v. SQL
Groupby functions are a common query practice in SQL and are necessary for many reasons within Pandas. Below is a quick example of how to construct similar queries in each syntax. Please note that SQL syntaxes can differ in detail, but the same rough format applies here.
Groupby Single Columns
SELECT Beds, sum(Acres)
FROM DATA
GROUP BY 1
#Pandas groupby function
DATA.groupby(['Beds'])['Acres'].sum()Groupby Multiple Columns
#SQL Statement
SELECT Beds, Baths, sum(Acres)
FROM DATA
GROUP BY 1, 2
#Pandas groupby function
DATA.groupby(['Beds','Baths'])['Acres'].sum()Groupby Arguments in Pandas
The first thing we need to do to start understanding the functions available in the groupby function within Pandas.
DataFrame.groupby(by=None, axis=0, level=None, as_index=True, sort=True, group_keys=True, squeeze=False, **kwargs)- by – this allows us to select the column(s) we want to group the data by
- axis – the default level is 0, but can be set based on the number of groups you set
- level – this is for multi-index groupings where we can group by a specific level or levels
- as_index – Set to True, this provides the output with the grouping columns as the index. When set to False, the values are returned in an SQL-like format
- sort – This sorts the group keys
- group_keys – When calling apply, add group keys to index to identify pieces
- squeeze – squeeze helps reduce the dimensionality of what the function returns
So let’s get started going through our sample dataset and how each of these arguments can be applied. The first simple command we’ll try is to group by the number of Beds in our dataset and get the average of Acres per bed.
df.groupby('Beds')['Acres'].mean()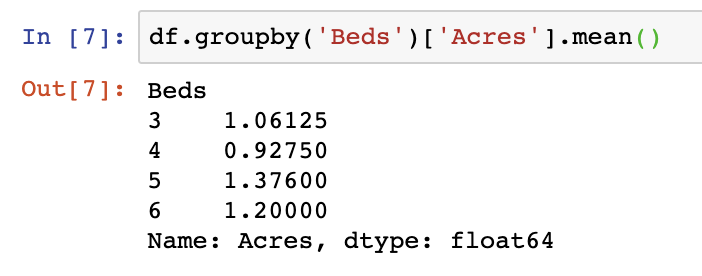
We can see that the output shows Beds on the right-hand side as our index of the Series object response. The Series itself contains the average value of Acres per Bed.
The next critical argument we recommend using is the sort argument. In the below we sort by Beds in a descending way, which we can see gives a descending response on the first index:
df.groupby(['Beds','Baths'],sort=0).mean()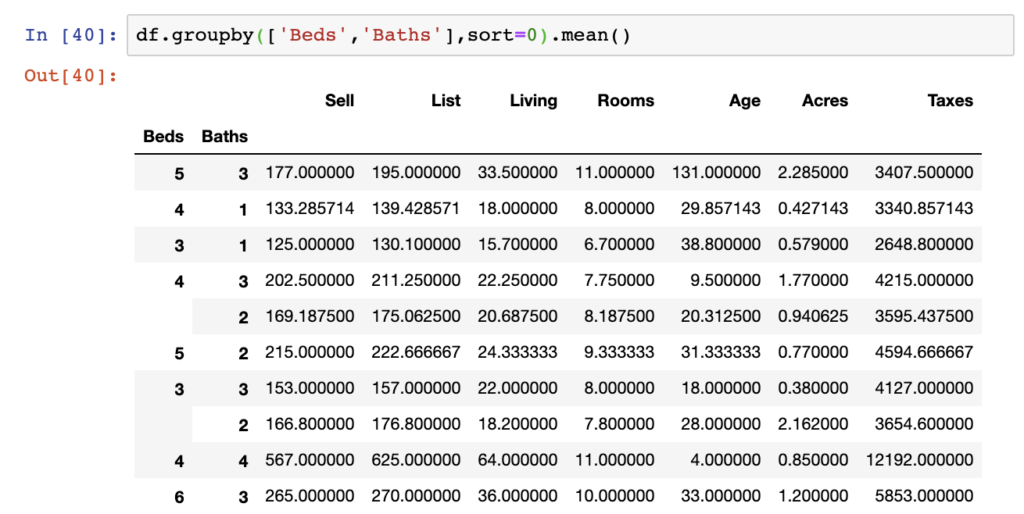
The last argument we want to cover provides a result that isn’t indexed on the group by statements.
df.groupby(['Beds','Baths'],as_index=False).mean()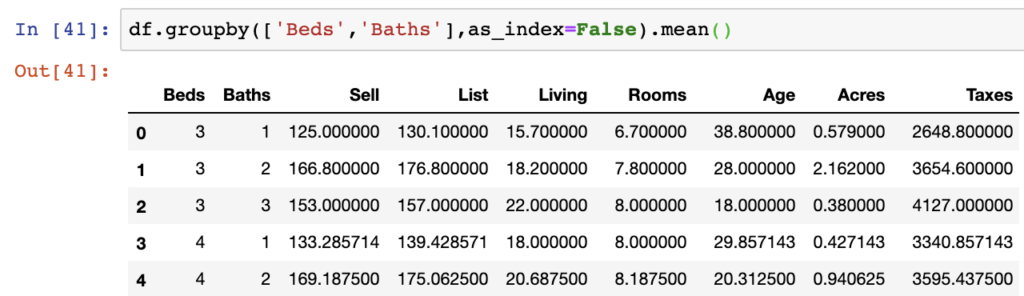
This results in a DataFrame object but removes that initial indexing we see in the example above this. A similar output exists in a Series, however the index can be reset here as well.
df.groupby('Beds',as_index=False)['Acres'].mean()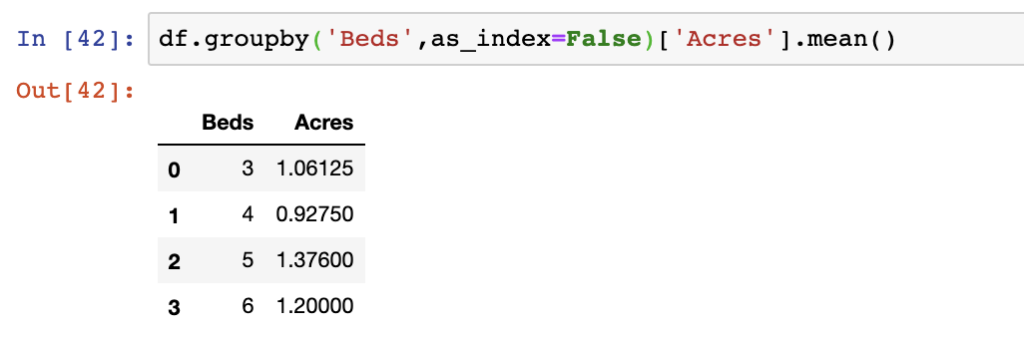
While we showed some examples of this in the above section, grouping by multiple columns in your DataFrame is a common task:
df.groupby(['Beds','Baths']).mean()Extract Groupby Statistics
There are many summary statistics that can be extracted from your data using groupby functions. We’re not going to cover them all here, but we can show some simple examples of the below. We’ve already shown many examples of the mean() function, but let’s cover describe() which contains several descriptive statistics:
df.groupby('Beds')['Acres'].describe()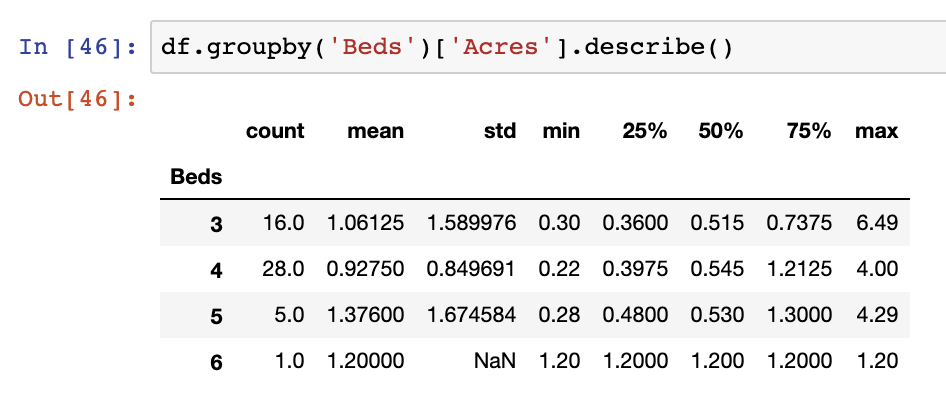
The full list of functions available within groupby are below:
mean() | Compute mean of groups |
sum() | Compute sum of group values |
size() | Compute group sizes |
count() | Compute count of group |
std() | Standard deviation of groups |
var() | Compute variance of groups |
sem() | Standard error of the mean of groups |
describe() | Generates descriptive statistics |
first() | Compute first of group values |
last() | Compute last of group values |
nth() | Take nth value, or a subset if n is a list |
min() | Compute min of group values |
max() | Compute max of group values |
Additionally, if we want to get two specific statistics, we can use the agg() function on your data. agg() allows you to apply multiple functions such as getting mean and count outputs at the same time – this can be applied to many of the above functions at once. Below we apply the agg() function to the mean and count statistics.
df.groupby(['Beds', 'Baths'])['Acres'].agg(['mean', 'count'])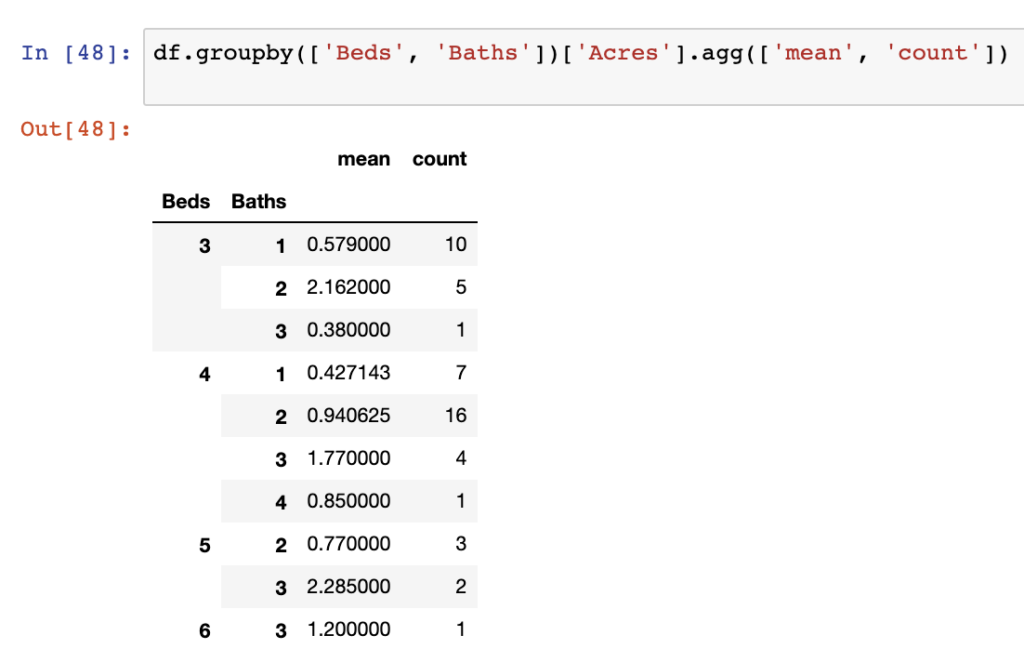
Apply Multiple Columns to Groupby Function
We covered the agg() function in the last post, but we want to expand on it a bit to show how powerful it can be when you need to extract multiple statistical functions from your dataset at once. In the example below, we actually show several differing functions applied to the same
df.groupby('Baths')['Acres'].agg({'Acres':['sum', 'max'],
                         'Mean':'mean',
                         'Sum':'sum',
                         'Diff': lambda x: x.max() - x.min()})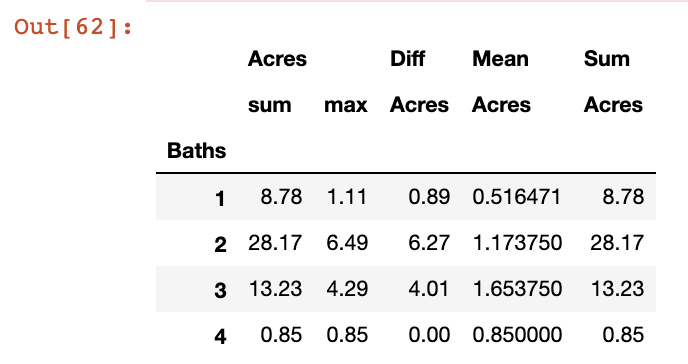
Within the agg() function we can label each of the outputs in the grouping by the Baths variable. In the fist instance we label the first stats of sum and max as “Acres”, we then label the second statistic (mean) as Mean, then we label the sum statistic as Sum, and the last statistic where we subtract the min value in the column from the max value using a lambda function, we label ‘Diff’.
Access Groupby DataFrame by Key with Get_Group
One additional function we can use alongside groupby is the get_group function. get_group allows us to extract stats on a specific grouping from our output groupby object. For instance, if we want to get the mean statistics when the Baths variable is equal to one.
df.groupby('Baths').get_group(1).mean()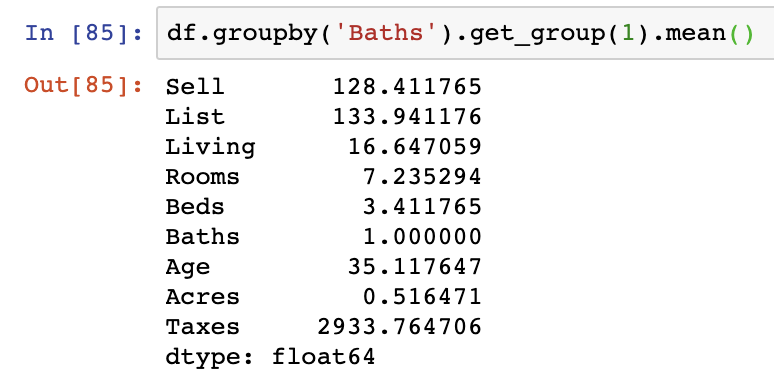
Convert Groupby Results to a DataFrame
We touched on the as_index argument above, but one of the most asked questions around the output of the groupby function is to get it directly into a DataFrame format without indexing by the grouped variables. There are two very common approaches to dealing with this question.
The first choice is to use the as_index argument within the groupby function itself:
df.groupby(['Beds','Baths'],as_index=False).mean()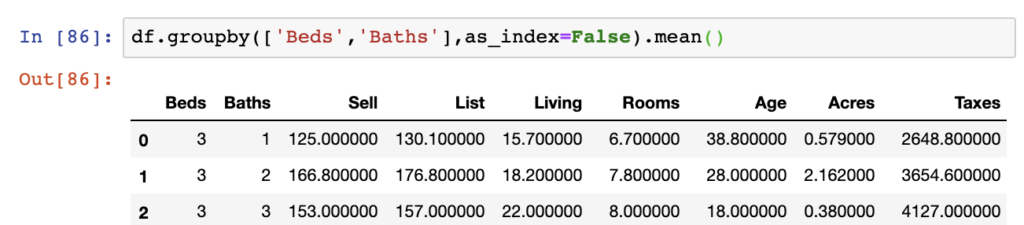
The second approach here is to use the Pandas function reset_index() which resets the index on a DataFrame to start at zero and puts any existing index values into columnar format.
df.groupby(['Beds','Baths']).mean().reset_index()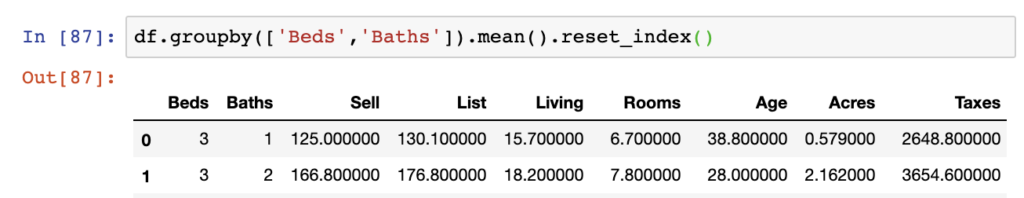
Apply Groupby Results to a List
Performing analysis sometimes means extracting data from groupby functions into a list format instead of a larger DataFrame format. In the below, we can use the apply function using the apply(list) function within Pandas on top of our groupby outputs.
df.groupby('Baths')['Acres'].apply(list)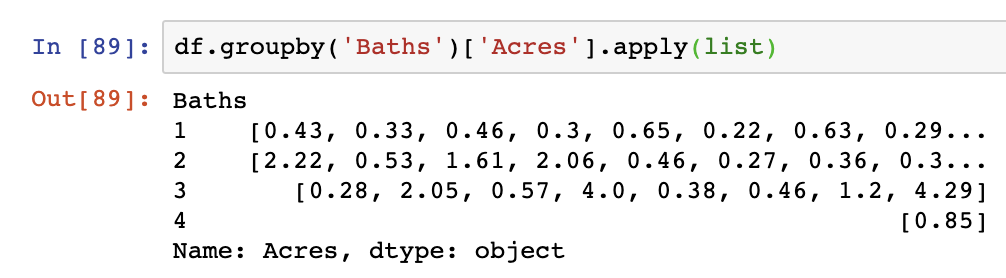
Summary
In this post we’ve covered nearly all the critical aspects of how the groupby function works in Pandas. Just a quick recap of our coverage:
- SQL v. Pandas Groupby Statements
- Groupby arguments in Pandas
- Statistics available in Groupby statements
- The get_group function
- Outputting results in various DataFrame formats
- Writing groupby outputs to lists
Other critical references for how to use groupby functions in detail are below:
- Chapter 9: Data Aggregation & Group Operations from the book Python for Data Analysis
- The official Pandas library documentation: https://pandas.pydata.org/pandas-docs/stable/reference/api/pandas.DataFrame.groupby.html
- Groupby statements from Real Python: https://realpython.com/pandas-groupby/
- Geeks for Geek’s Groupby functions https://www.geeksforgeeks.org/python-pandas-dataframe-groupby/