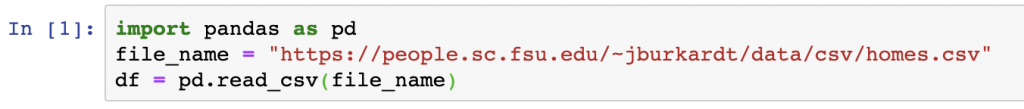
The first action analysts take with a new Pandas DataFrame should be to perform a quick exploration of the data on columns. In this tutorial, we cover how to review a DataFrame for basic information about the columns and data itself. We stop short of traditional Exploratory Data Analysis in this post but cover simple examination steps. In this tutorial, we’ll be exploring an open-source dataset from FSU:
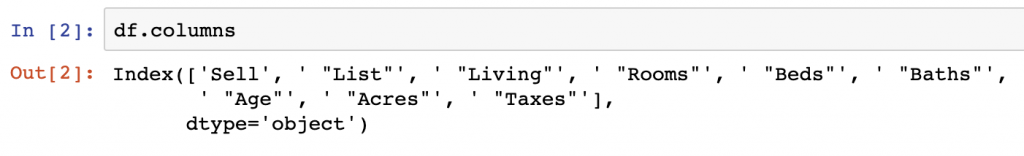
DataFrame.columns
Listing column names is a regularly used method to understand the data in your DataFrame as it is currently labeled. To do so, you will need to use the DataFrame.columns function to return a basic list of columns.
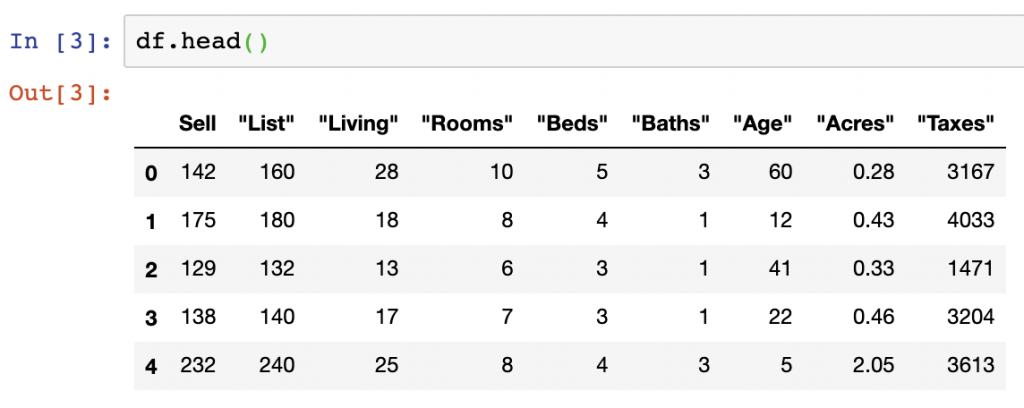
DataFrame.head()
Viewing data using DataFrame.head() is a quick and simplistic way to view the top rows in your DataFrame. Columns will be truncated if you have too many of them, showing only the first and last columns.
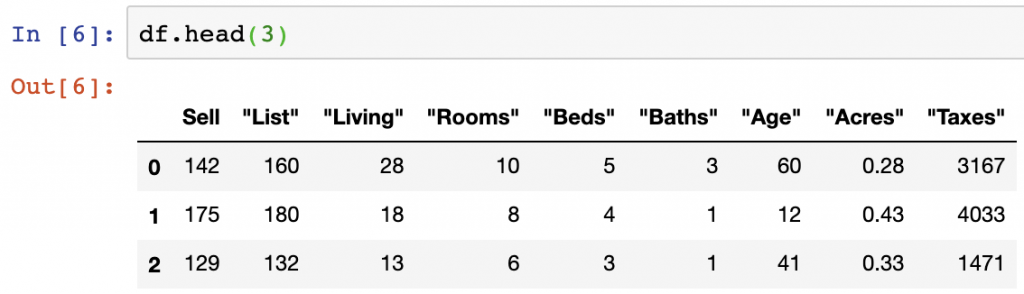
The DataFrame.head() function can also be used to view a specific amount of rows. While the default setting is 5 rows, you can input the number of rows you want to view into the function – in the below, we input 3 rows:
DataFrame.dtypes
Seeing data types using DataFrame.dtypes helps list out the data types of the columns being manipulated. This is often useful as some columns may appear to be stored as integer values if viewed using .head(), when in reality they are float values.
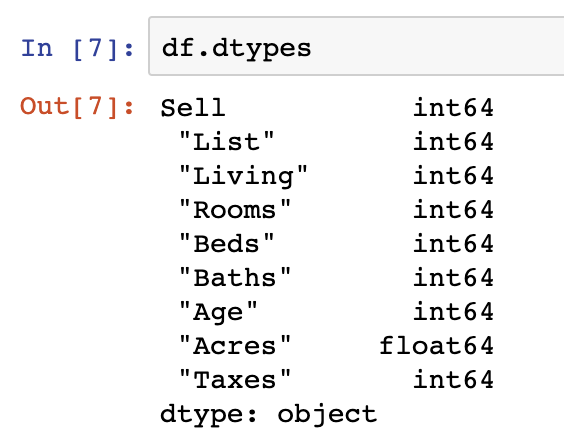
For more on understanding the output of dtypes and how to interpret the data types used in Pandas, see our previous post.
DataFrame.describe()
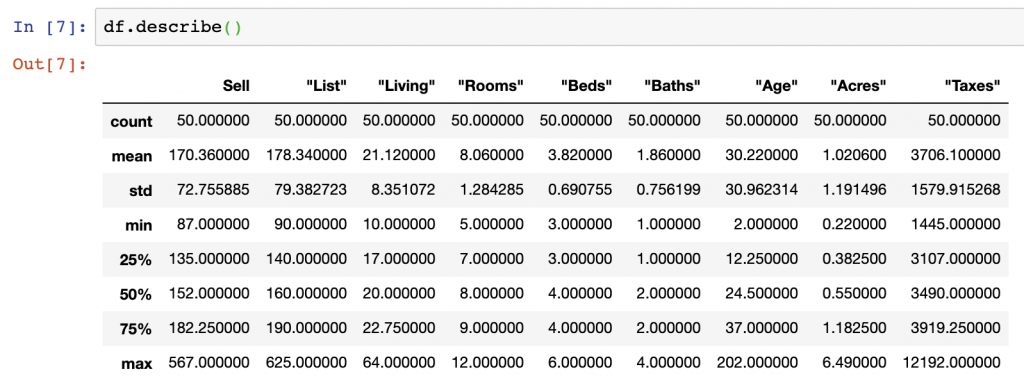
DataFrame.describe() is another useful way to explore the contents of Pandas columns as it helps show statistical distributions of integer and float values. We see from the below that all the columns containing float or integer values (all the columns in our current DataFrame) are analyzed in the describe function.
Describe provides the: count; mean; standard deviation; minimum value; the 25% value; the 50% value; the 75% value; and the max value of each column.
Finding NaN Values
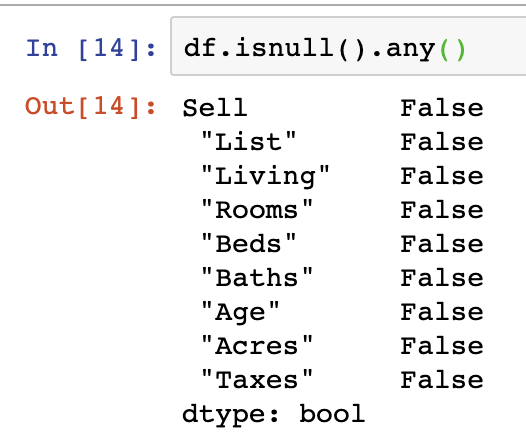
While we now understand the contents of our columns in terms of data types and some summary statistics, we need to check to see if there are missing values to ensure we have a consistent and valid analysis later.
NaN values can be managed in several ways, however, the easiest way to check your DataFrame for DataFrame.isnull().any(). In the case of our dataset, there are not any missing values in our data set:
df.isnull().any()There is additionally a means of summing the number of null/NaN values which is simple to perform in a similar function to the above:
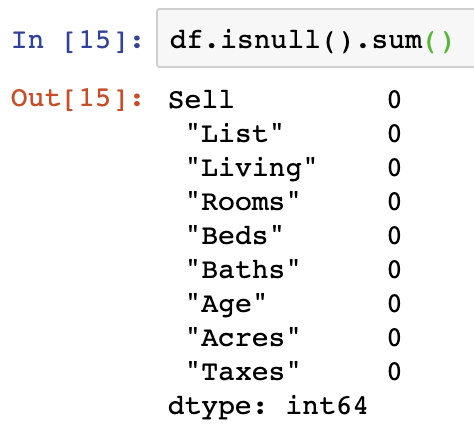
df.isnull().sum()Obviously, as we don’t have NaN values in the dataset, we can use the above as an example.
Summary
When jumping into a new dataset, all analysts must understand the contents of their data. We’ve covered here how to call the columns, a header preview of the data, data types, and statistical summary description of our DataFrame columns.
For the code surfaced in the screenshots above, please visit our GitHub repository on Data Analysis. More information on common Pandas operations can be found in our detailed tutorials.