This article contains affiliate links. For more, please read the T&Cs.
As soon as you open a new dataset in Pandas, you’re likely going to want to perform some minimal analysis on that data, and more likely, you’ll want to count. Counting with Pandas is very straightforward and there are three primary functions available to you to do this. Some are more advanced and perform nuanced functions such as counting records v. counting individual values v. providing generalized summary statistics including counts. All of these approaches are useful and easy to perform.
Using count()
count(self, level=None)
The count() function is by far the simplest function for counting records from the given dataframe or series selected.

When we run count() on a dataframe the output provided is a count of all of the non NaN (or blank) records in each of the columns within the dataframe.
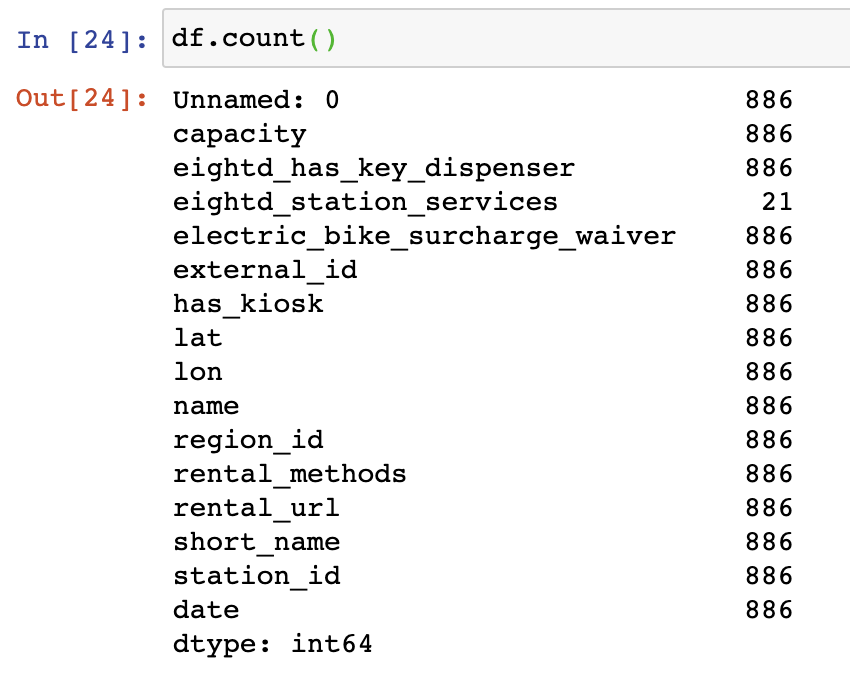
df.count() This also works if we are selecting specific rows as well for instance if we were to limit our current dataframe by the capacity column where the rerecords are equal to or greater than 30. In this case, we’re only pulling up a count of the series, or capacity column, so we get back an integer response with the count of records.
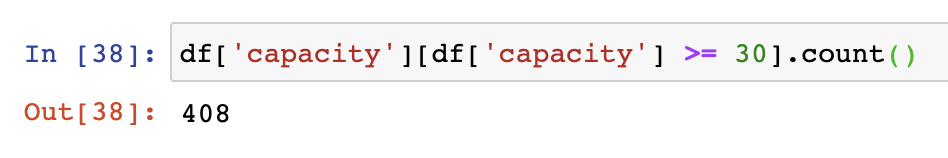
df['capacity'][df['capacity'] >= 30].count()Using value_counts()
value_counts(self, normalize=False, sort=True, ascending=False, bins=None, dropna=True)
The value_counts function works only on Pandas series objects, and can be quite useful. Unlike the other functions in this list, value_counts will provide the count of each unique record within the series.
As in the examples above, we’ll filter down to the capacity series where the values are greater than 60. We then apply value_counts and we get a count of each unique record within that dataframe.
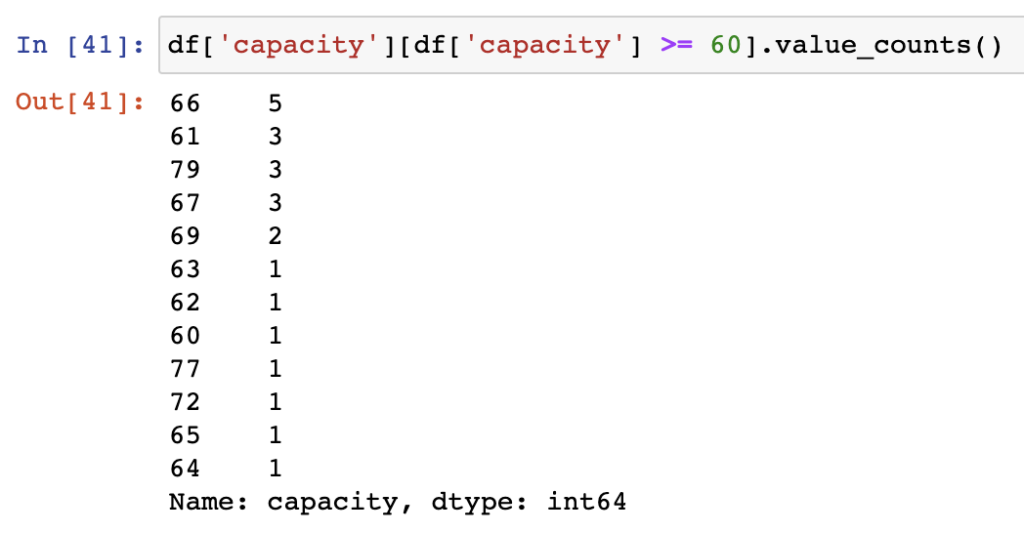
df['capacity'][df['capacity'] >= 60].value_counts()The nice thing about this type of output is that it makes an immediately available set of statistics for examination or visualization. Using the hist() function we can quickly get a histogram of the output series values for the counted values.
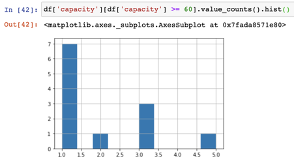
df['capacity'][df['capacity'] >= 60].value_counts().hist()The main thing to remember with the value_counts function is not to run this function on a column with too many, or all, unique values or it may be a little useless to view.
Using describe()
describe(self: ~FrameOrSeries, percentiles=None, include=None, exclude=None)
If you’re looking for a bit more detail than just the count of records within your dataframe or series, use the describe()function and you can get additional information such as the mean, standard deviation, min, max, 25%, 50% and 75% thresholds within the data that is either a float or integer datatype column. You will not be getting counts of records that are any other datatypes, for that you may want to try some of the other functions.
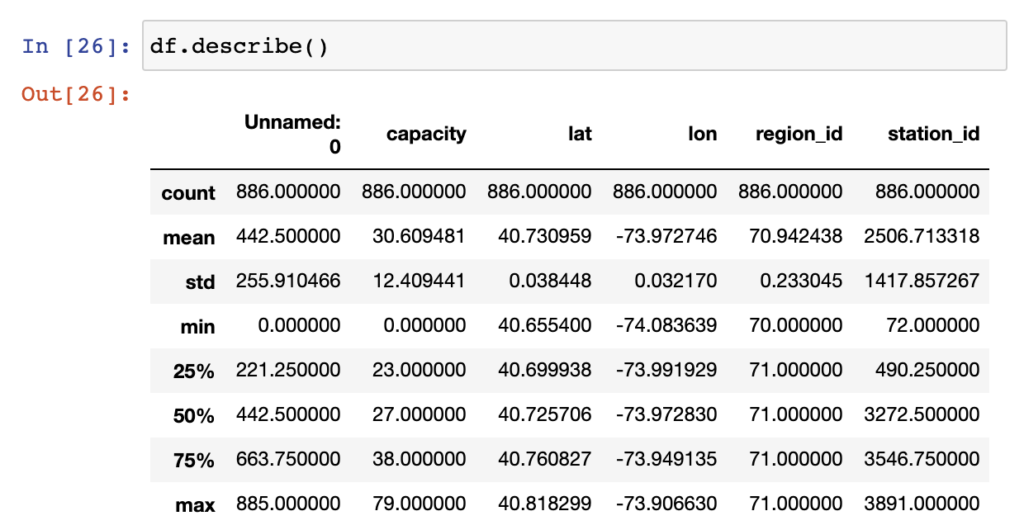
df.describe()As you can see from the above, not all the columns are showning counts, or any other values, in the output. To identify which columns you’ll be getting statistics on, you can use the df.dtypes function.
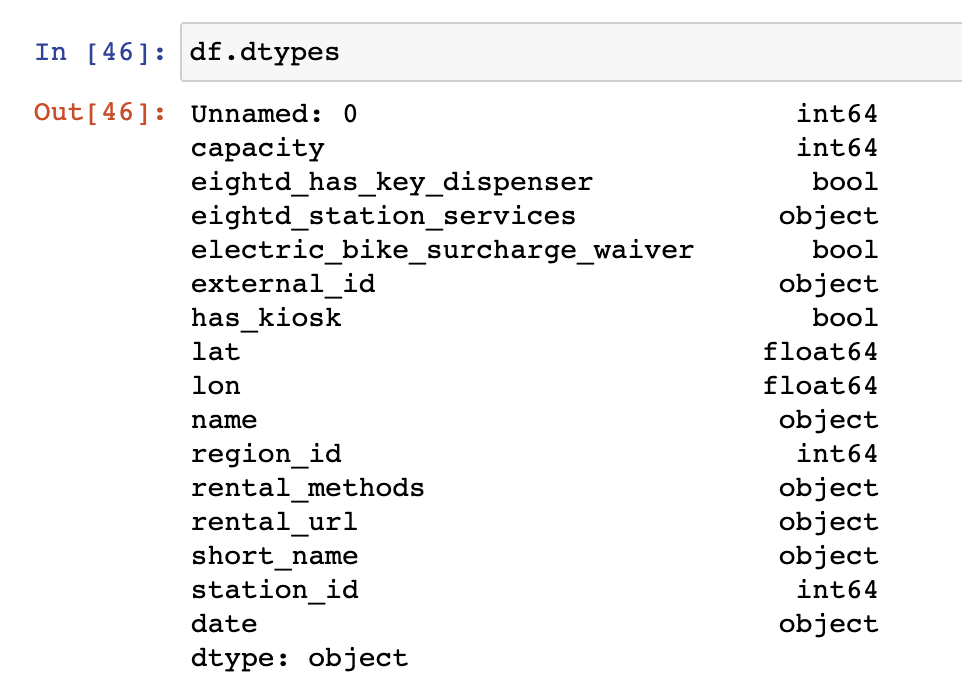
df.dtypesYou can find more on datatypes in Pandas elsewhere on this site.
References
When it comes to pulling basic counts within Pandas, it’s easy to find a function that will work for your use case, and the three above should be your go-to functions.
So what do they each do again?
- Counts() counts all records within the dataframe or series it’s run on
- Describe() provides several summary statistics about the dataframe or series object
- value_counts provides the count of each unique record within the series selected
Additional Sources:
Chapter 5 of Python for Data Analysis: Getting Started with Pandas
- Pandas Official Documentation for counts()
- Pandas Official Documentation for value_counts()
- Pandas Official Documentation for describe()