NaN values are common within data analysis. NaN values can be generated as a result of data loading, data manipulation, and other data transformation practices. So what exactly are they? NaN values are similar to NULL values or empty values as seen in other programming languages or objects. This simply means there is no content to them. They’re technically considered Float values so if you have them present in a DataFrame or Series that could throw off some of your ability to perform normal data manipulation without eliminating or changing the existing NaN values.
In this tutorial, we’ll work with some sample data from an FSU open dataset as well as some simulated data points to give us an understanding of how we can manage NaN values in DataFrames. This data is available here. We’re going to cover identifying the presence of NaN values, removing, replacing, and filtering NaN values.
Check for NaN Values
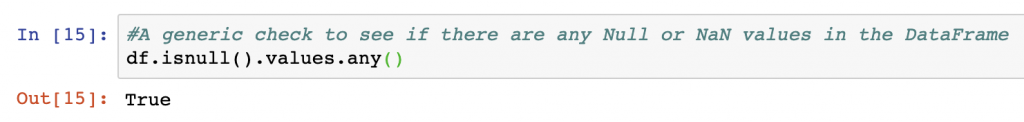
To check if your DataFrame contains any NaN values whatsoever you can use a simple command of DataFrame.isnull().values.any(). There are several functions here that are used from the Pandas package that include isnulI() , values, and any(). The response from this combination of functions is True or False, with True indicating there are NaN values in a DataFrame. For our example dataset, this is the case and we can see from the below the output:
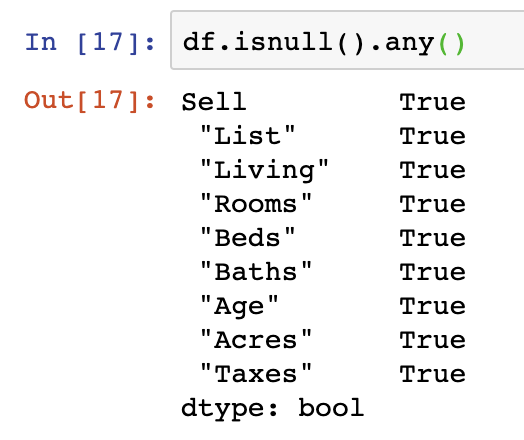
While this simple function tells you if there are missing values in the DataFrame, it doesn’t help tell you much about the columns or volume of missing values. For that we must take two approaches. The first is the use of a similar functions however they’re applied to all columns in the DataFrames DataFrame.isnull().any() function and DataFrame.isnull().sum().
Count NaN
Identifying that NaN values exist is one operation, but the volume of those values can impact an analysis greatly. To count NaN values, there are several quick techniques you may want to try.
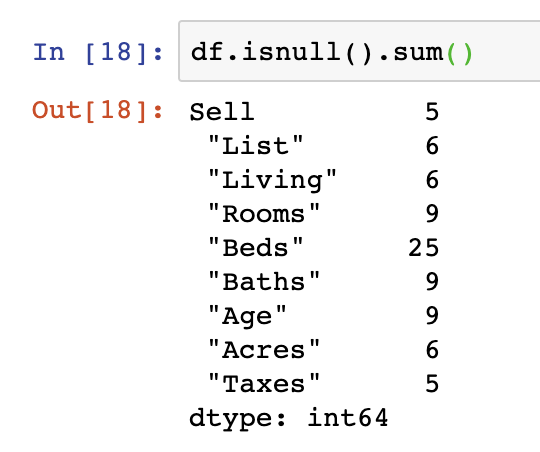
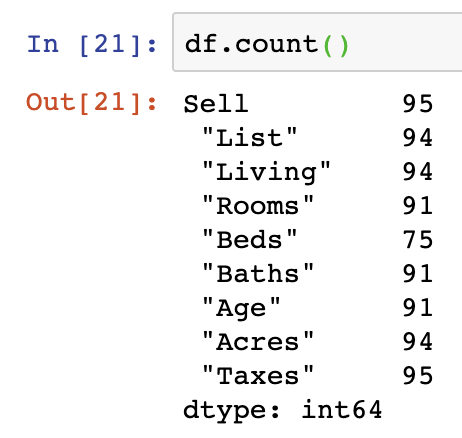
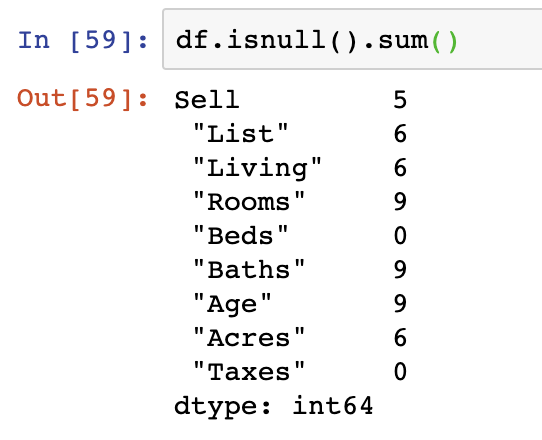
The first of these provides the count of NaN values in every column in a DataFrame and is by far the most useful as you can see count by individual column to understand where the biggest gaps are. In this case, the “Beds” column contains 25 NaN values.
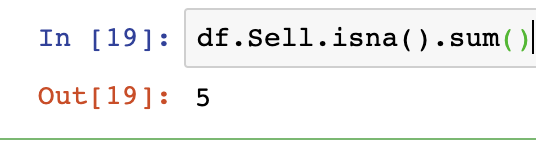
Checking an individual column means specifying that column as an object using DataFrame.Series.isna().sum() with your variable names for DataFrame and Series in a format similar to the below:
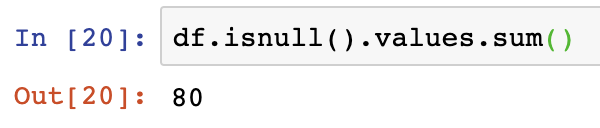
Lastly, to get a count of all the NaN values in our DataFrame, we should use the DataFrame.isnull().values.sum() function. In the below we see that the output of this is 80 for the sample DataFrame we’re using in this analysis.
Drop NaN Values
As Pandas lets you read from various data sources we often find that records can end up with blank or NaN values in a DataFrame. Depending on your data preparation or manipulation needs you may want to remove or augment the DataFrame you’re working with to eliminate NaN values. To drop NaN value rows from a DataFrame can be handled using several functions in Pandas.
Not all approaches to dropping NaN values are the best. The scorched earth approach is to drop all NaN values from your dataframe using DataFrame.dropna(). dropna() will remove all the rows containing NaN values. We can see from the below the effect by exercising DataFrame.count() with and without the dropna() function. The absolute difference in the total number of rows is a reduction of 25 rows:

There are several other arguments to pass into dropna() which can be used that are outlined here in the third answer on the forum.
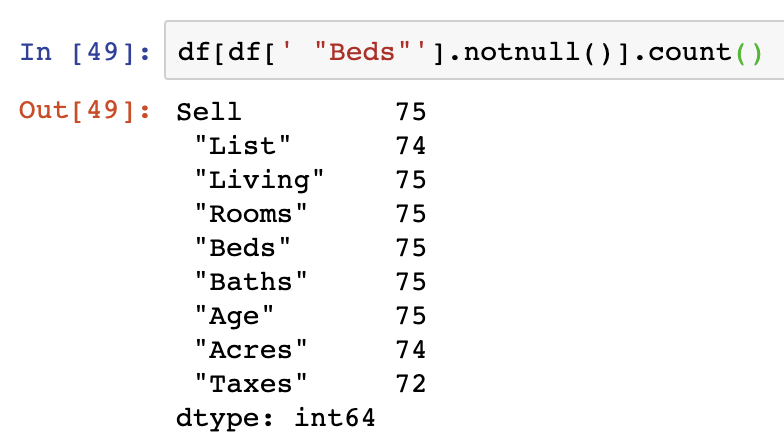
To understand how to remove specific NaN values in a Series within your dataframe, you can still use notnull() on the Series you want NaN values dropped from specified. Here we apply this to the “Beds” Series in the DataFrame:
Another alternative to this is to use the isfinite() function from NumPy on the Series that we are interested in filtering on.
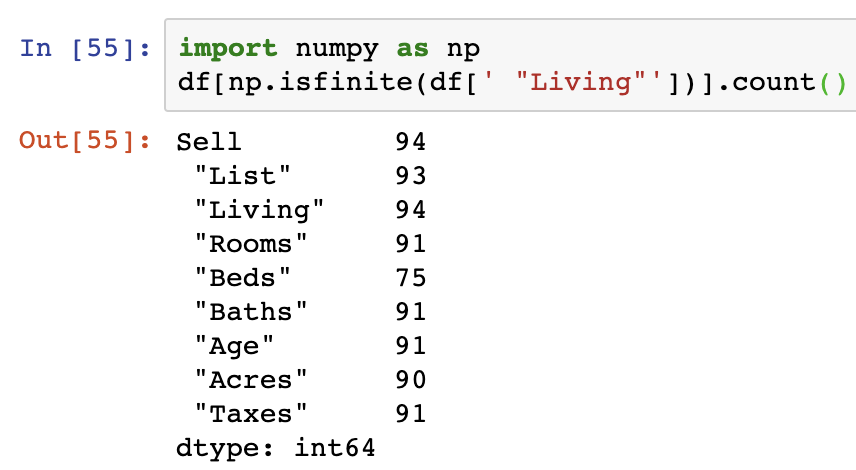
Note that in this example and the above, the .count() function is not not actually required and is only used to illustrate the changes in the row counts resulting from the use of these functions.
Replace NaN Values
To replace NaN values in a DataFrame, we can make use of several effective functions from the Pandas library. The most commonly used approaches are the .fillna() and .replace() functions. The main value to be inserted into the function as an argument is the value argument, which enables us to replace the existing value of all NaN/NA values in the DataFrame with whatever we select.
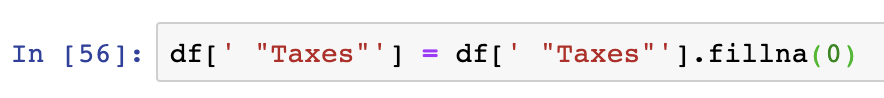
The fillna() function is applied on a DataFrame specifically designed in Pandas to identify and fill in NaN values. This same approach can be applied to a specific column within the DataFrame as well. We can see in the below that the fillna() function can be applied to replace NaN values in columns with almost any value including 0 or an empty string value ”. When counting the null values after these two operations are performed, we see that both the Series changed have 0 NaN records.

replace() is applied to the DataFrame object an includes many arguments to pass in to replace nan values. The quickest approach is to pass in the np.nan object as the value to be replaced, then the value you wish to replace it by (0 in the case below), and then to specify that we would like regex=True to be used as the last argument – enabling the replacement of the nan values by regex logic. However, given that NaN values are technically NumPy objects, we have to compare with np.nan in our logic as shown below:
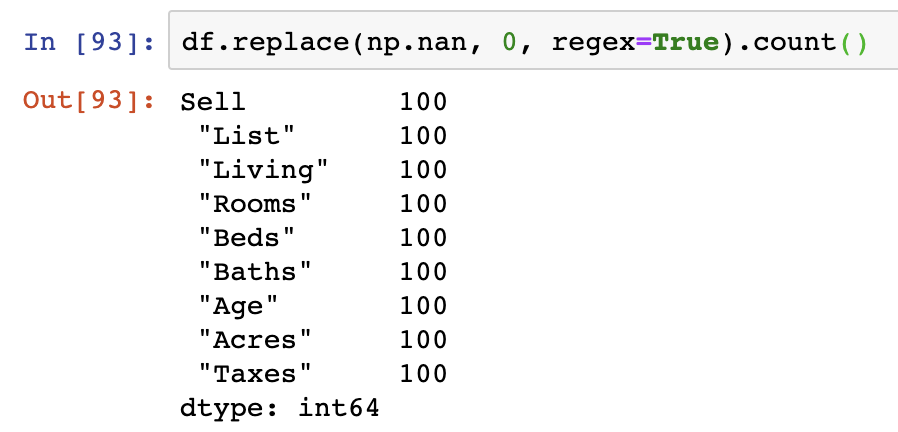
This operation actually replaces all NaN values with 0 and we can see that the values in our DataFrame match that of the count of the index, indicating that all NaN values have been replaced with values.
Filter out NaN Values
Another way of removing NaN values completely from a DataFrame is to re-assign the variable after performing one of several functions to remove NaN values.

Additional details on how to filter out rows can be found here.
After this tutorial you should be able to get row and column counts in Pandas. For the code surfaced in the screenshots above, please visit our GitHub repository on Data Analysis. More information on common Pandas operations can be found in our detailed tutorials.